InTDS ArchivebyNikki SmitThe 7 R Packages You Should Be Using for Data VisualisationWith Example Code and Free Datasets .Dec 2, 20211Dec 2, 20211
InAnalytics VidhyabyNikki SmitTableau — Custom Colour Palettes3 Steps in adding your most identifiable asset to your dashboardsJan 15, 2021Jan 15, 2021
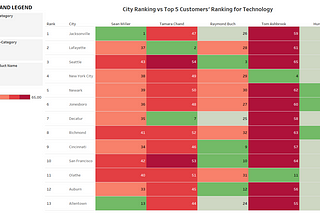
InAnalytics VidhyabyNikki SmitTableau — Rank within RankWhat’s the highest rank in the popcorn army?Jan 15, 2021Jan 15, 2021
InAnalytics VidhyabyNikki SmitWhat is Econometrics?With a working example of regression analysis using sklearn in PythonJan 19, 2021Jan 19, 2021
InAnalytics VidhyabyNikki SmitCreating Your First Dynamic Tableau DashboardFilled with growth rate calculations, parameters, dynamic filters, symbols, conditional formatting, custom financial years and it is…Jan 22, 2021Jan 22, 2021
InAnalytics VidhyabyNikki SmitAn Ode to Coffee and Scikit-LearnWith the appearance of the Multiple Linear Regression and the Dummy Variable trap.Feb 1, 2021Feb 1, 2021
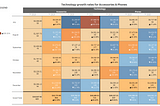
InAnalytics VidhyabyNikki SmitThe Magic of Month-over-Month GrowthHow Tableau can help identify if your company is following a linear or exponetial growth trend.Mar 26, 2021Mar 26, 2021
InAnalytics VidhyabyNikki SmitMarket Share vs Contribution ShareHow to show market share accurately in Tableau using level of detail calculations.Apr 1, 20211Apr 1, 20211
InAnalytics VidhyabyNikki SmitA Tip Before Entering the World of DataAnd you are going to need it!Apr 12, 2021Apr 12, 2021
InAnalytics VidhyabyNikki SmitData GovernanceHow to export your calculations from Tableau to Excel using PythonApr 28, 2021Apr 28, 2021
InAnalytics VidhyabyNikki SmitAzure Data ExplorerUnderstanding the basics on why and when it is usefulAug 16, 2021Aug 16, 2021
InTDS ArchivebyNikki SmitForecasting the Sale of SnowboardsA time series exercise from scratchAug 26, 2021Aug 26, 2021
InTDS ArchivebyNikki SmitThis Is How You Should Be Visualizing Your Data10 Examples to Guide Your AnalysisNov 8, 20211Nov 8, 20211
Nikki SmitHow the Formula 1 Can Help You to Understand Under and Over FittingWhen to Identify It and What You Can Do About ItNov 16, 20211Nov 16, 20211
Nikki SmitNew Tableau FunctionThis Long Awaited Feature Just Made Your Life a Whole Lot Easier.Dec 16, 2022Dec 16, 2022
InAnalytics VidhyabyNikki SmitIt Is Time to Try CanvasXpressA Tutorial on a New Data Visualization Package for All Levels.Sep 6, 2022Sep 6, 2022